Exploring the Debates
Campaigns debates are an interesting platform – one of the only opportunities for the candidates to appear together, in a symmetric sort of setting for the viewers (and the candidates). And one of the few moments when aspiring leaders can speak at length to a mass audience about their values, priorities, and policy intentions.
The first general election debate of 2016 broke records for presidential debate viewership, with about 84M viewers; this fell in the second debate with a still re-spectable 67M (against NFL football), and a third place record of 72M for the third debate.
My iniital corpus is the combined speech of Clinton and of Trump in each of their debate appearces, pulled from UCSB’s The American Presidency Project. Because I started this after the primaries, I ended up ignoring the rhetoric of the also-rans.
I used rvest to acquire the data - you can see the script acquire_debates.R on GitHub. Probably the most widely used package for working with a corpus in R is tm, but here I’m using a newer package, quanteda. I wanted documents that reflected the speech acts of individual candidates. The transcripts read in as one blob, so I extracted the speaker, split by the speaker, and created an object that retained each speaker. Using this, I generated a corpus, assigned document names and variables, and started exploring the text.
Let’s start with the complexity of the speech. The Flesch-Kincaid readability scores is only one of the readability measures available in quanteda. It’s normalized to grade level reading and captures how difficult a text is to understand. It’s a function of average sentence length and average:
\[0.39\left(\frac{total\,words}{total\,sentences}\right)+11.8\left(\frac{total\,syllables}{total\,words}\right)-15.59\]
library(tidyverse)
library(quanteda)
library(scales)

setwd("../../../dataForDemocracy/debate2016analysis/")
load("debateSpeech2016.RData") # the corpus as created in acquire_debates.R

fk <- textstat_readability(debate16corpus, measure = "Flesch.Kincaid")
debates16$readability <- fk # add measure to data frame

# And plot!
p <- ggplot(debates16, aes(x = date, y = readability))
# Add color for party, better labels/formatting for axes
p + geom_point(aes(color=party, shape=speaker), size=3) +
  scale_x_date(labels = date_format("%m/%d"), breaks = date_breaks("5 weeks")) + # (scales)
  ggtitle("'Readability' of Candidate Debate Speech") +
  labs(y = "Readability (grade level)", x = "Date of Debate") +
  scale_color_manual(values=c("blue3", "orange3"), name="Speaker", guide=guide_legend(reverse = TRUE)) +
  scale_shape_manual(values=c(19,19,1,1)) + guides(shape=FALSE) +
  theme(plot.title = element_text(face="bold", size=20, hjust=0)) +
  theme(axis.title = element_text(face="bold", size=16)) +
  theme(panel.grid.minor = element_blank(), legend.position = c(0.77,0.9), legend.text=element_text(face="bold", size=12))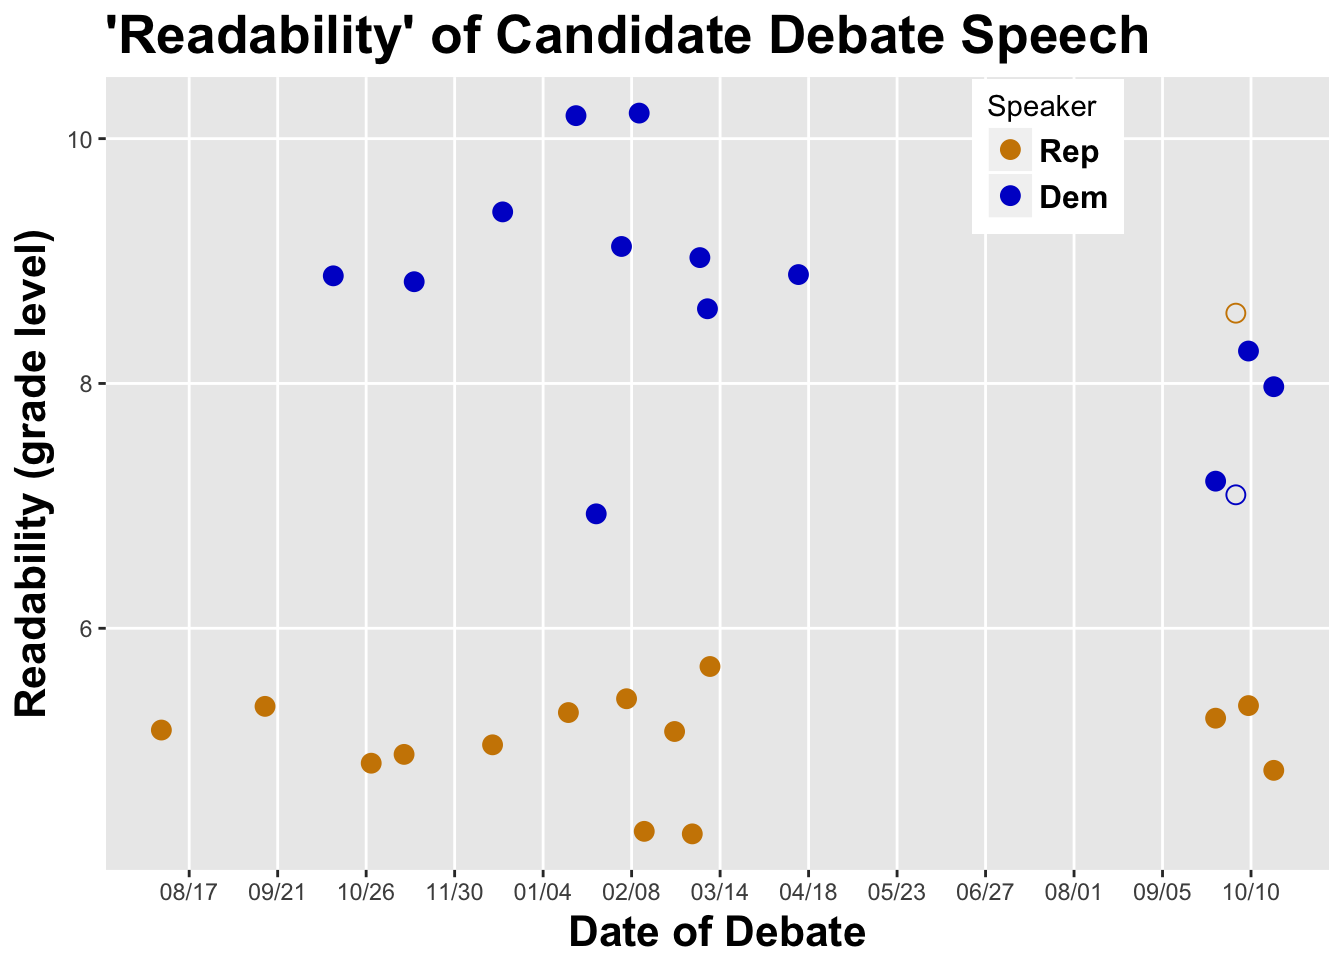
Trump was, by this measure at least, consistent across the primary and general election contexts, averaging a 4.3 grade level to Clinton’s 8.1 grade level. And the hollow orange dot near the top is Pence, who bears little resemblance to Trump on this score. The difference is primarily, though not wholly, a function of sentence length; Trump speaks in shorter sentences. And Clinton’s dip in the first general election appears to be a result of the frequent interruptions, reducing her sentence length in this processing of the text. Time reports 55 interruptions by Trump in September – about 30 were interruptions of Clinton (rather than of debate moderators) – but only 15 interruptsion by Trump in October – when only a couple were interruptions of Clinton.1
For comparison, I’ve pulled the general debate transcripts from 1960, 1976 and every campaign since, and Trump sets the record for “least complex” debate speech – the runner up is Bush the first in 1992 (with an average of 5.4th grade). The 2016 lineup also generated the biggest average difference between the candidates, at 3.8: the next largest difference was in 1996, with a gap of 2 grades, from Bill Clinton’s 7.5 to Bob Dole’s 5.5.